COVID-19 Infection Tracker
A full-stack data aggregation and visualisation platform tracking real-time COVID-19 statistics globally, with a Python backend and Vue.js frontend.
Overview
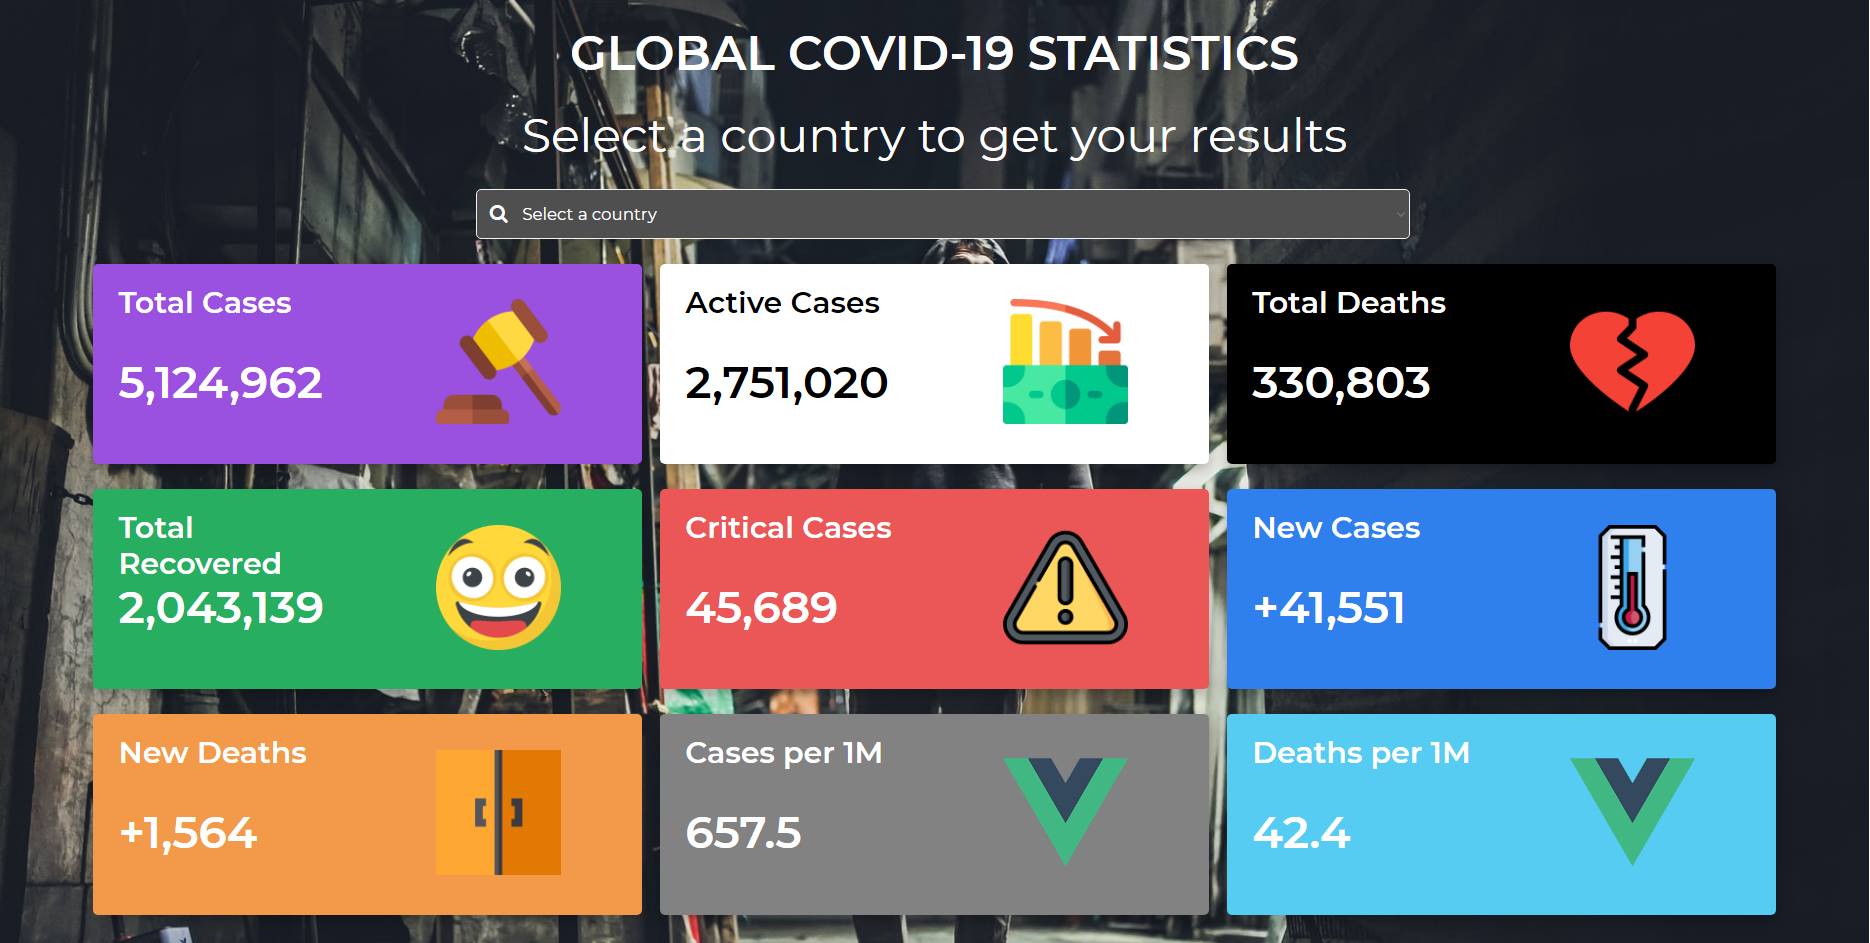
Built in 2020 during the height of the COVID-19 pandemic, this full-stack application aggregated real-time infection statistics from trusted global data sources and presented them through an interactive, country-searchable dashboard. The backend (Python) normalised data from multiple sources into a unified REST API, while the frontend (Vue.js) provided live visualisations and statistical metrics.
Architecture
Backend (Python)
- Aggregated COVID-19 data from multiple trusted sources
- Normalised inconsistent data formats into a standardised schema
- Exposed a RESTful API for frontend consumption
- Scheduled periodic data refreshes to maintain near real-time statistics
Frontend (Vue.js)
- Responsive dashboard with global and country-level statistics
- Real-time search and filtering by country
- Colour-coded stat cards for quick visual assessment (cases, deaths, recoveries, critical cases)
- Per-million metrics for contextual comparison across regions
- Mobile-optimised layout
Key Features
- Global summary — aggregate worldwide totals across all metrics
- Searchable country index — instant lookup of any country's current statistics
- Stat cards — total cases, active cases, recoveries, deaths, critical cases, new cases/deaths, and per-1M ratios
- Responsive design — seamless experience across desktop and mobile devices
Learnings
This project was formative in understanding full-stack data pipelines. Key takeaways included:
- Data normalisation — reconciling inconsistent reporting formats from different sources
- API design — building reliable endpoints that serve rapidly changing data
- Component-based UI — structuring Vue.js components for reusability and maintainability
- Real-time systems — handling data freshness, caching, and user expectations during a global crisis
The experience reinforced the value of clean, accessible dashboards during critical events — users relied on this application to make informed decisions about health and safety.